
SIEM Home Lab Series (Part 3)
Thumbnail image "Computer code" by Markus Spiske is marked with CC0 1.0
This is the third part of a multi-part series on building a SIEM lab and training with ‘Purple Team’ skills. I say ‘Purple’ because while the emphasis will be on ‘Blue Team’ activities we will also need to use ‘Red Team’ techniques to populate our SIEM with relevant data. The series will be broken out into the following parts:
Investigating with Elastic Agent
In part one we set up the SIEM using the Elastic Stack and if you are not familiar with Elastic or you want to follow along exactly as I do then feel free to check that out first.
In part two our primary focus was on understanding and setting up the correct type of event logging in our lab as well as installing and configuring the Elastic agents that will collect these events and ship them to our SIEM.
In this third part we are going to generate “malicious activities” via the Atomic Red Team framework and analyze them in the SIEM.
Kibana Overview
Before jumping in let’s do a quick review of the Kibana dashboard and some of the major features we are going to use.
As of version 7.10 there are five main sections of which we are going to focus on two - Kibana itself and Security.
I am going to show you some of the ins and outs but I would highly recommend you look at Kibana’s documentation as it will give much more detail than what I can do here.
Discover
Let’s start by expanding the Kibana section and clicking on ‘Discover’.
This can be thought of as the more general purpose tool for searching all of the data collected into your Elastic Stack. You can check the Discover documentation for a deep dive but I want to point out a few features that we will use in a bit.
Firstly, understand that all data that feeds into Elastic gets put into an index based on several configurable factors; the default setup goes something like “<source-agent><agent-version><timestamp>”.
Let’s say that you have multiple days of Winlogbeat data:
winlogbeat-7.10.1-2021.01.02
winlogbeat-7.10.1-2021.01.03
winlogbeat-7.10.1-2021.01.04
etc…
These are logically grouped together into an index pattern for use in Kibana:
Notice that each one matches a particular index type but ends with a wildcard (*) that matches all indexes of that type.
This makes it super convenient to filter different index types in Kibana Discover:
So now we can easily filter on logs from the Elastic Agent running on our test PC…
…versus logs from the Winlogbeat agent running on our Active Directory server.
When we get to the exploitation part of this post I will show you some helpful ways to parse the logs to make them MUCH easier to analyze but for now just remember that the Discover page is where you go to view all logs in the system.
Security
The next major part of Kibana to focus on is the Overview tab in Security.
There are lots of great features here and Elastic is aggressively developing their security offerings; you can read their Security documentation to get more details.
The Overview page gives you…an overview…of everything going on security-wise in your Elastic Stack.
(sorry for the scrunched up screenshot - I had to zoom way out to show everything)
One thing to take a closer look at is Host Events at the bottom of the page.
Expand the drop-down for both Elastic Security and Winlogbeat and you get a more detailed breakdown of source data from each agent that Elastic Security is pulling from. Here we can see what types of data are feeding in from the agents that are installed on our test workstation and our domain controller.
Next, let’s go to the Detections page.
This is a fresh Elastic Stack installation so there currently isn’t much to look at but we can change that by clicking Manage detection rules on the far right.
Next, click the button that says Load Elastic prebuilt rules and timeline templates.
It may take a few minutes to load everything for the first time but once it completes you should see the bottom half of the screen populated with a list (316 as of this writing) of detections built by Elastic.
These detections are meant to identify suspicious behavior in your environment and if you are a SOC Analyst this is going to be the meat and potatoes of your daily interaction with Elastic security.
Apart from the detections built by Elastic you can also create your own custom ones by clicking on Create new rule on the far right.
This is part of the real value in an Elastic SIEM and we’ll explore custom rules a bit more in depth when we start exploiting systems in our lab.
Command Line Audit Logging
There is one last configuration to set up in our network that I forgot to go over in part 2 of this series and that is command line audit logging. Basically, when commands are executed in either the Windows command line or Powershell we want the logs to include those specific commands. This is circumstantially nice to have in your production environment and maps to the CIS 20 security control number 8.8.
First make sure your advanced audit settings include Detailed Tracking -> Audit Process Creation
Then use Group Policy to enable command line logging for both your default domain policy as well as the default domain controller policy.
Don’t forget to enable logging on Powershell as well.
Computer Configuration -> Administrative Templates -> Windows Components -> Windows Powershell
Automated Testing
Now that we’ve reviewed our SIEM’s UI and gotten a feel for how to use it we can start training ourselves on how to identify potentially malicious traffic. In this post we are going to focus on a tool called Atomic Red Team and if you are not familiar then think of it more or less as a set of scripts that are designed to mimic malicious techniques as documented by the Mitre ATT&CK Framework.
I should point out that you can and should use this tool to test the efficacy of other products besides Elastic. You can run these same tests and check them against Splunk, Crowdstrike, Cylance, etc to see what those products will catch.
See below for a playlist of short tutorials on how to set up ART in your lab (I am only installing it on the Windows workstation for now).
Side note: make sure you turn off Windows Defender and disable malware protection in Elastic Security BEFORE trying to install Atomic Red Team - no special reason, I totally didn’t waste several hours troubleshooting this or anything 🙂
If you want a slightly deeper dive I would highly recommend this video which was part of a class that was presented at Defcon 2020.
Once we finish installing ART we can start our testing.
I have the Elastic Agent in ‘detect’ mode which is configured in Security -> Administration -> Integration Policy
Credential Dumping
One of the things an attacker may try to do after compromising a host and elevating their priviledges is dump any user credentials that may be stored in memory. There are a number of ways to do this but we are going to test it via the SAM database.
The Atomic test for this is T1003.002 #1 but first let’s double check and make sure we meet all the prerequisites (no response is good and means that everything checked out).
Then we run the test from a Powershell terminal that is run as Administrator.
We did the dirty deed but how do we find it in Elastic?
A quick look in the Discover tab shows that there are over 345k logs that have been ingested since I booted up my lab.
There is no single best way to search for evil and everybody has their own methodology. This situation is a bit contrived since we already know exactly what I did but let’s pretend that we don’t - but that we know approximately when it happened.
The first step then is to search based on timestamps. I like to pick the first log that I see, filter the timestamp, and then edit the range that I want.
Click on the filter, then edit…
…change the setting to be a range…
…and give ourselves a 30-second window.
You can see now the number of events has been reduced dramatically from 345k to just over 1k.
This is good but it’s still a lot of logs to sift through and we can tighten our filters even more. In the last post we made a point to turn on Audit Process Logging in our Group Policy settings which generates EventID 4688 in the Windows Event log and EventID 1 in Sysmon.
Let’s add those to our filter…
…and voila!
Much better.
Combing through sixteen log events is not unreasonable but there is still more we could do in order to make them easier to parse.
Expand one of the logs and scroll down until you see the ‘winlog.event_id’ field. Hover your mouse to the right of it and select ‘Toggle column in table’.
That doesn’t seem to help us much does it? Not yet but let’s keep adding to our filters - this time look for the ‘message’ field. This field is literally a copy of the original log itself but if you look right underneath it you can see each line of the log has been broken out into it’s own field. See where it says ‘process.command_line’? Hover your mouse to the right of that and toggle it as well.
At the beginning of our search we started with a wall of text and the daunting task of trying to sift through thousands of logs to find the one event we were interested in. Using what little we knew about the event we were able to clear away most of the information that was not relevant, iterating as we went, and now as your eye travels from the left of the screen to the right it is much easier to comprehend what happened and when. Scrolling through the list you should see two logs, one Windows event and one Sysmon event, that look pretty close to what our Atomic test was doing.
We’ve only begun to scratch the surface of what Elastic can do for us in terms of filtering and displaying data. Think about it - Elasticsearch parses almost every component of a log, breaks each one into a separate field, and merges the fields and the data together into a searchable index. Combine the index with the data manipulation capabilities of Kibana and there is almost no limit to the number of interpretations of your data that you can contrive.
Take some time to play around with it and you will discover new ways to push and pull your data that will sometimes lead to new perspectives. One important feature that we did not cover at all but is worth your time to look into is the Kibana Query Language.
Kibana Security
We’ve identified the interesting logs using the Discover functionality but what about the Security section of Kibana that we mentioned before?
I will show you a neat trick to avoid having to start your search all over again in another part of the application. Go to one of the interesting logs that we want to investigate further and click on the exact timestamp and filter for that value.
On the new filter you just selected click ‘Pin across all apps’ - you will see a small gray rectangle fill the left-most part of the filter box.
Now go straight from Discover to the Detections tab in Security.
You will see that there is nothing here, for now. This will be important later but I wanted to point out this part of the Security section before we move on.
Also, notice that our timestamp filter carried over from Discover to Security and will persist across every screen until we remove it.
Click on the Hosts tab and then towards the middle of the screen click on Events.
Scroll down the page a bit and you can see four events - two of which are the Windows and Sysmon logs and two are event logs generated by the Elastic Agent itself.
Let’s focus on the one whose message says ‘Endpoint Process Event’. To the left you can see a hexagonal shaped icon that says ‘Analyze Event’ when you hover your mouse over it.
Click it.
This functionality is called the Visual Event Analyzer and to quote from the documentation,
Elastic Security allows any event detected by Elastic Endpoint to be analyzed using a process-based visual analyzer. This enables security analysts to drill down into all related hosts, processes, and other events to aid in their investigations.
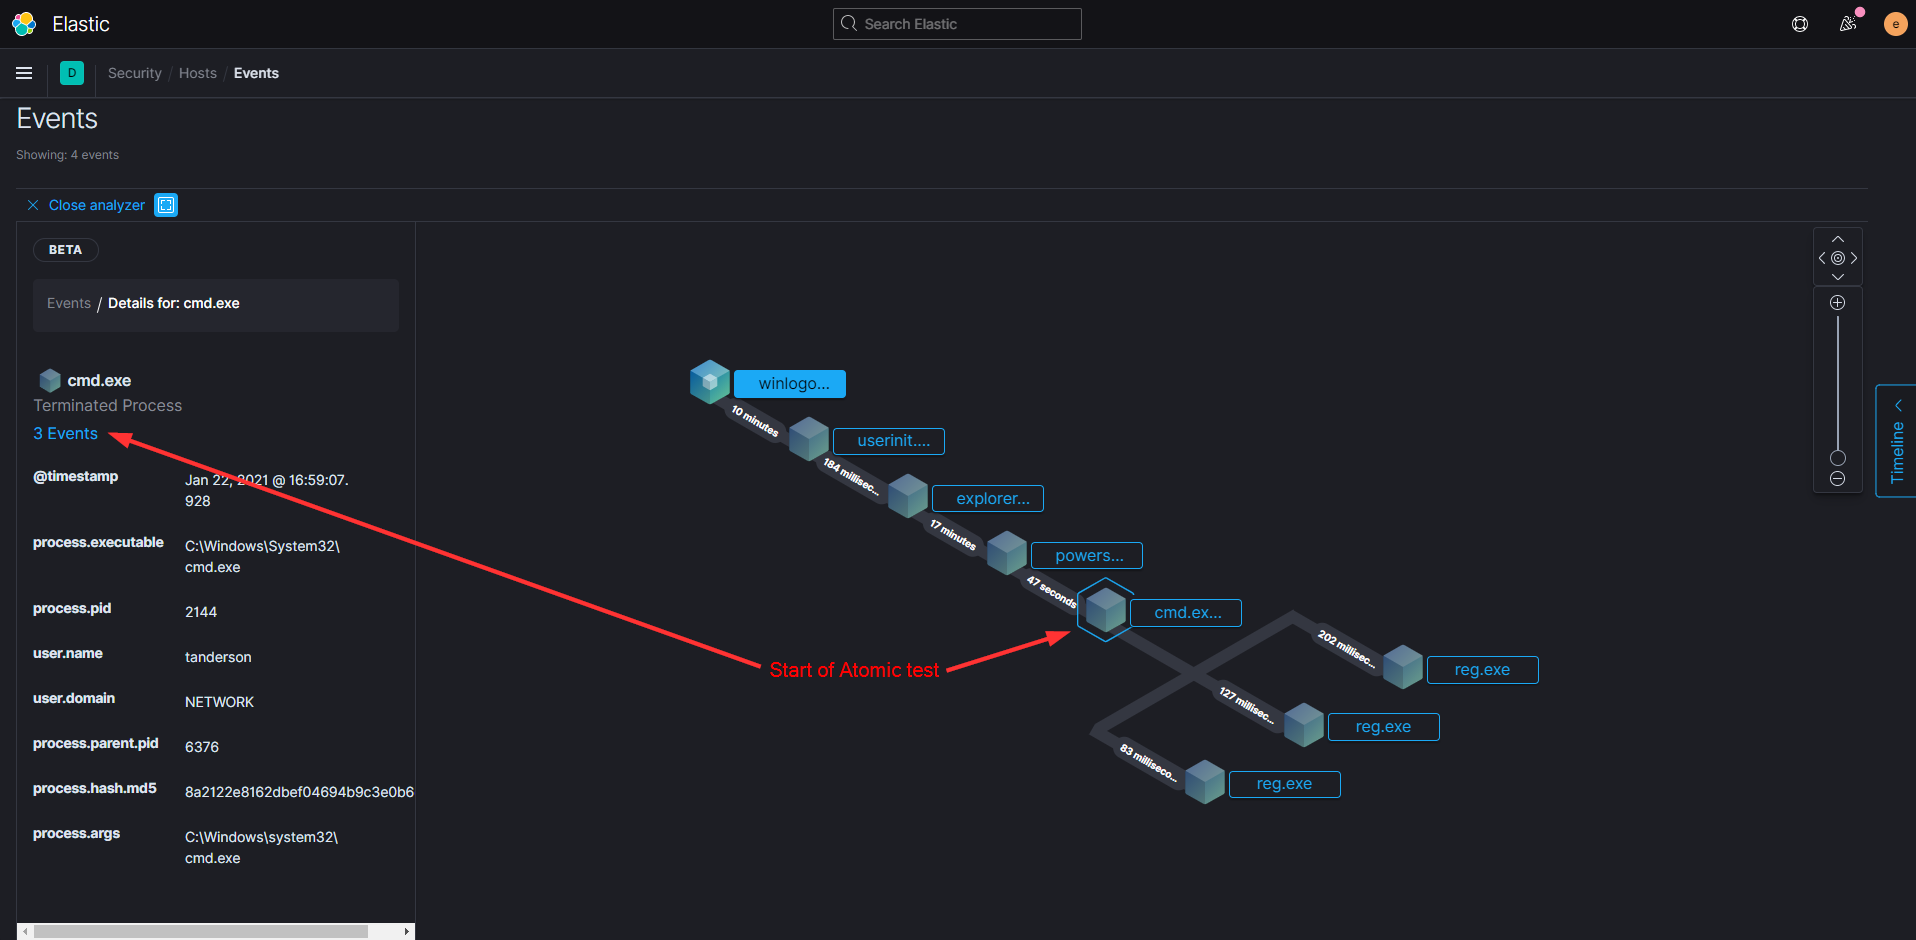
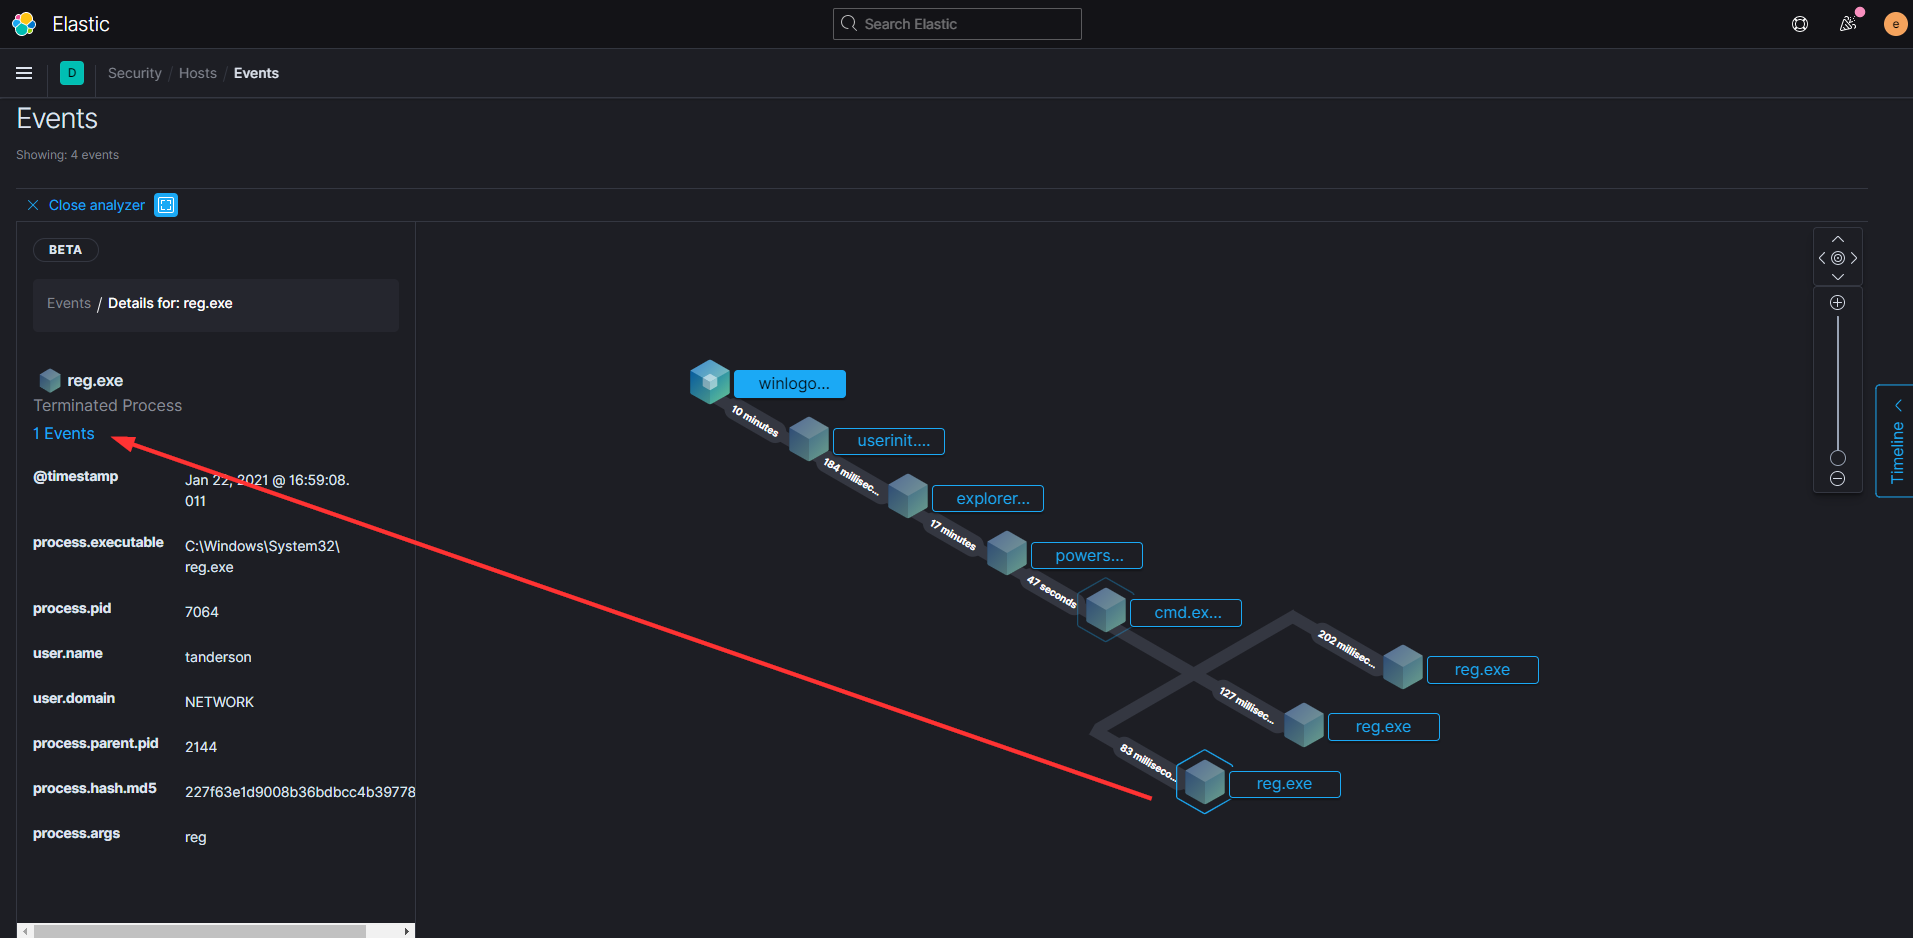
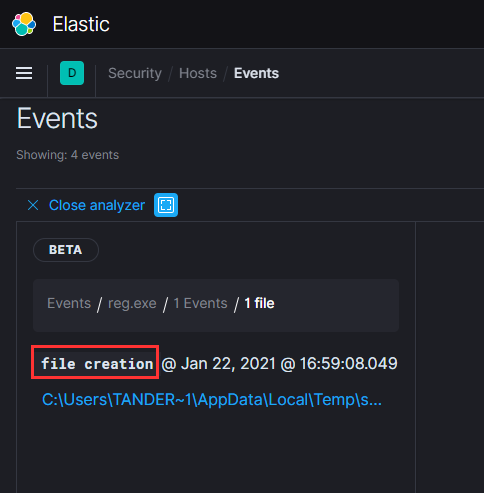
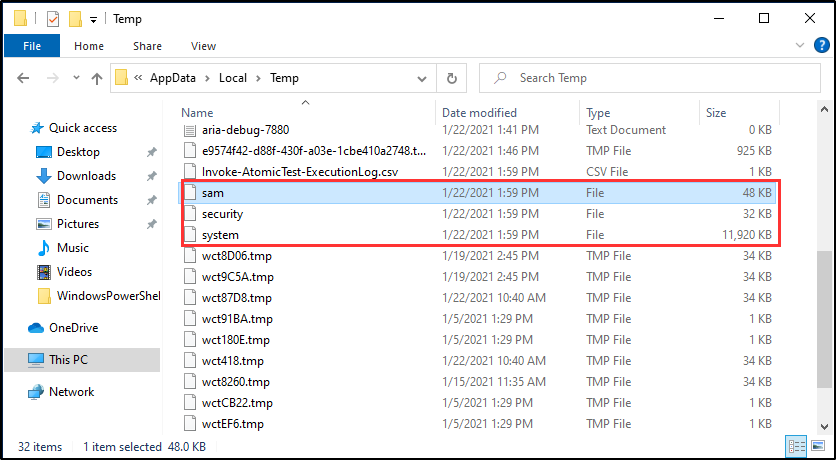
Do you recall how our Atomic test dumped the Local SAM (SAM & System), cached credentials (System & Security) and LSA secrets (System & Security) from the registry and saved them in the temp folder?
This is what that looks like from Elastic’s perspective.
You can see the cascade of processes that are involved before Powershell even starts and then the subsequent events after we run the Atomic test. When you click on any of the events it will show you more details on the left of your screen including the process ID, user account, and the full executable path.


Despite this scenario being rather contrived and simplistic hopefully it has helped your brain to begin to correlate cause and effect and inspires you to do some testing of your own.
We’ve got one more thing to cover in this post but first we want to remember to clean up after ourselves on the target workstation.
Detection
All of this has been fun but not very practical. How do we catch these sorts of events in situations where we don’t know when they are going to happen, or on which machine?
This is where detection rules finally come into play. Head back to the Detections tab and click on ‘Manage detection rules’.
Before we start enabling every single rule let’s pause and think strategically about the event we just investigated. What were some of it’s characteristics?
The “attack” used Powershell
Powershell spawned several child processes including cmd.exe
(Optional) The “attack” came from tanderson’s user account
Of course we can create custom detections if we want but let’s see if Elastic already has any pre-built that will fit our needs.
Sure enough, if we do a search for “powershell” we see there is already a pre-built detection that specifically looks for command shells that are spawned off of Powershell.
Notice a few details that match up nicely with the event we investigated:
Our test did indeed spawn several command shells that descended from Powershell
This detection is looking at the same indexes that contain our interesting event
The query is looking specifically for powershell.exe to be the parent and the child to be cmd.exe
Let’s activate the detection.
(Optionally we can also duplicate it and add specific usernames to the custom query - for example, if tanderson works in accounting then he probably has no business running Powershell on his machine and should be flagged for that kind of activity. On the other hand, Kyle the sysadmin over in IT runs Powershell every day and this detection would result in a lot of false positives; we do not want to include his account in the custom query.)
Run the test again on the target workstation and then wait (the detection defaults to firing once every five minutes). Don’t forget to clear any filters, else your results will be hidden!
Eventually you should see your activity show up in the timeline. As a bonus you can start investigating events right from the Detection tab without having to go back to Hosts.
From here it’s a simple process of test, investigate, configure detections, and repeat. You also have the capability to configure detections to generate emails and/or automated tickets that can then be tied into your company’s alerting system (we all love getting calls at 2am, right?).
Congratulations, you’ve made it to the end of another of my extremely verbose tutorials!
Originally this was supposed to be the last post in the series but I realized it was getting too long and the next example I want to show you will have to move to part 4. Next time we will use the Winlogbeat agent on the Active Directory server to try and catch some Kerberos attack techniques.
Take care and God bless.